
Mapping for food safety 4/4: Making data count
(4 of 4) Cross Posted from IIED blog www.iied.org/mapping-for-food-safety by Paolo Cravero

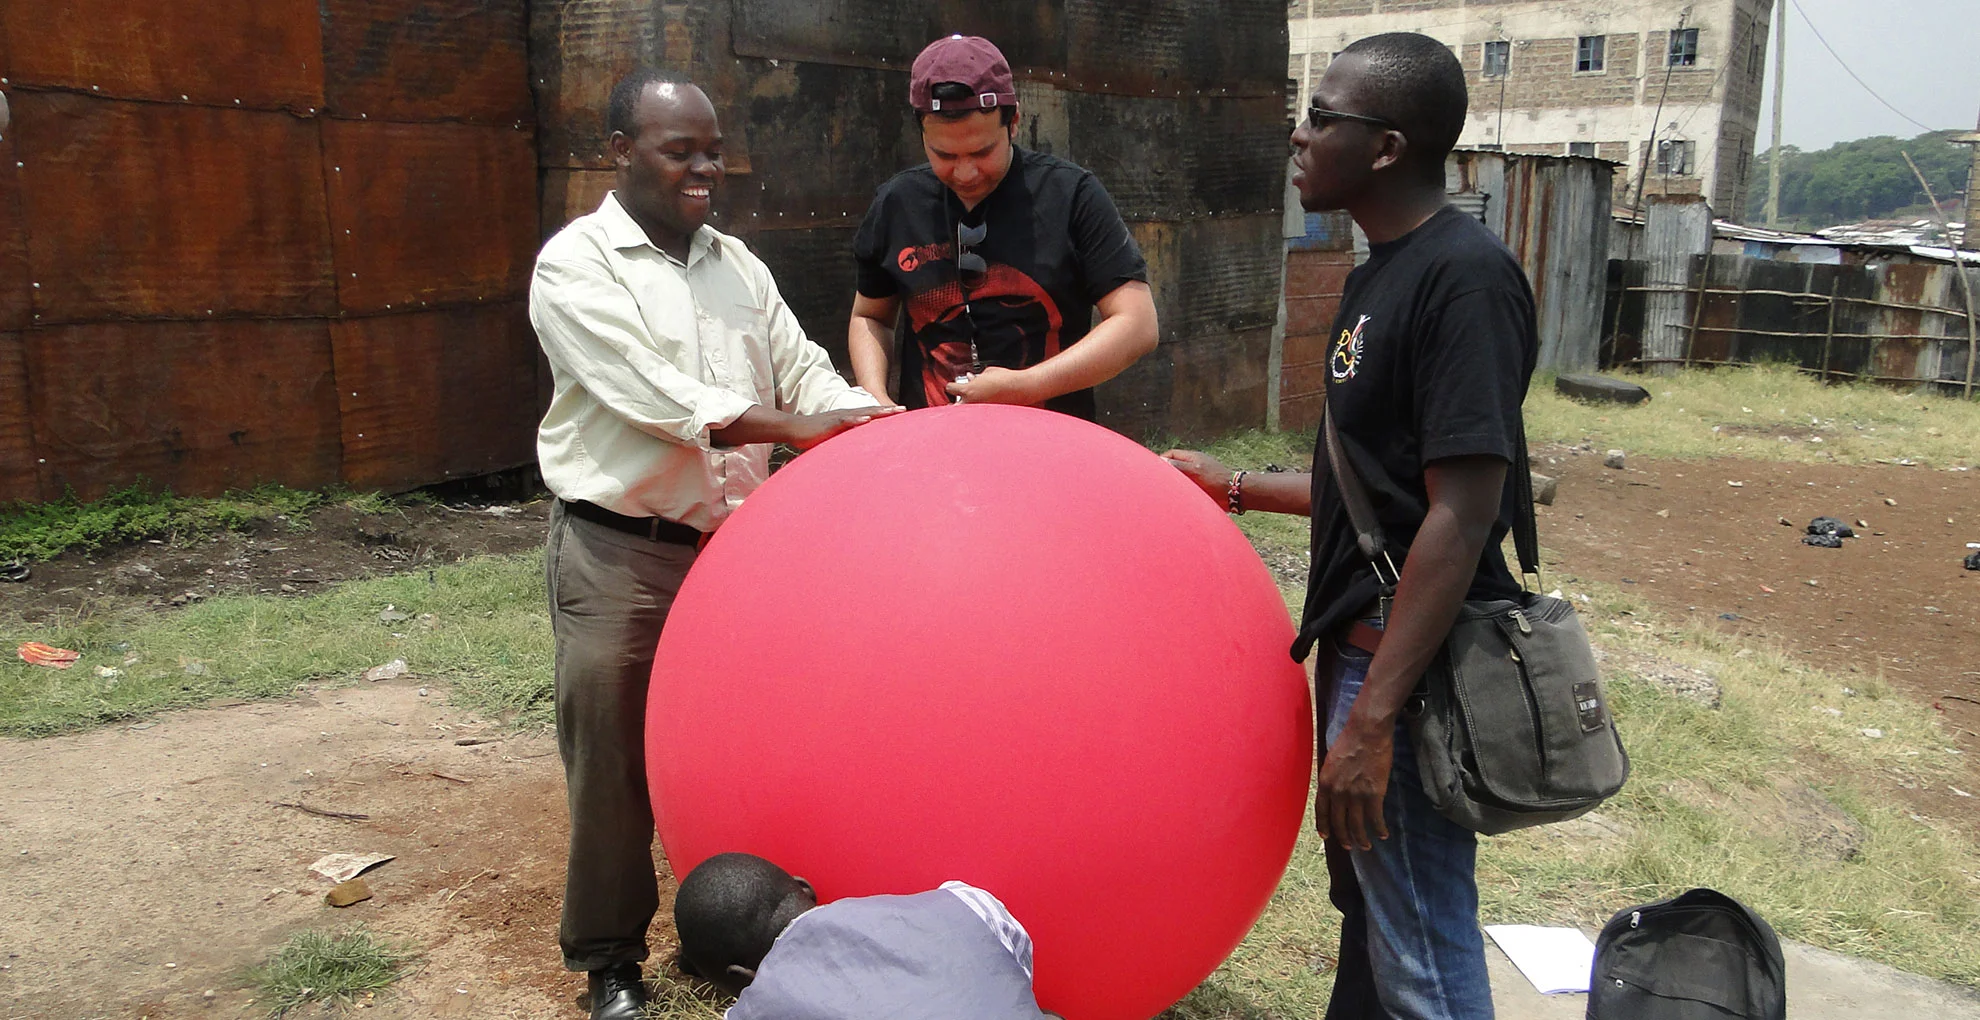

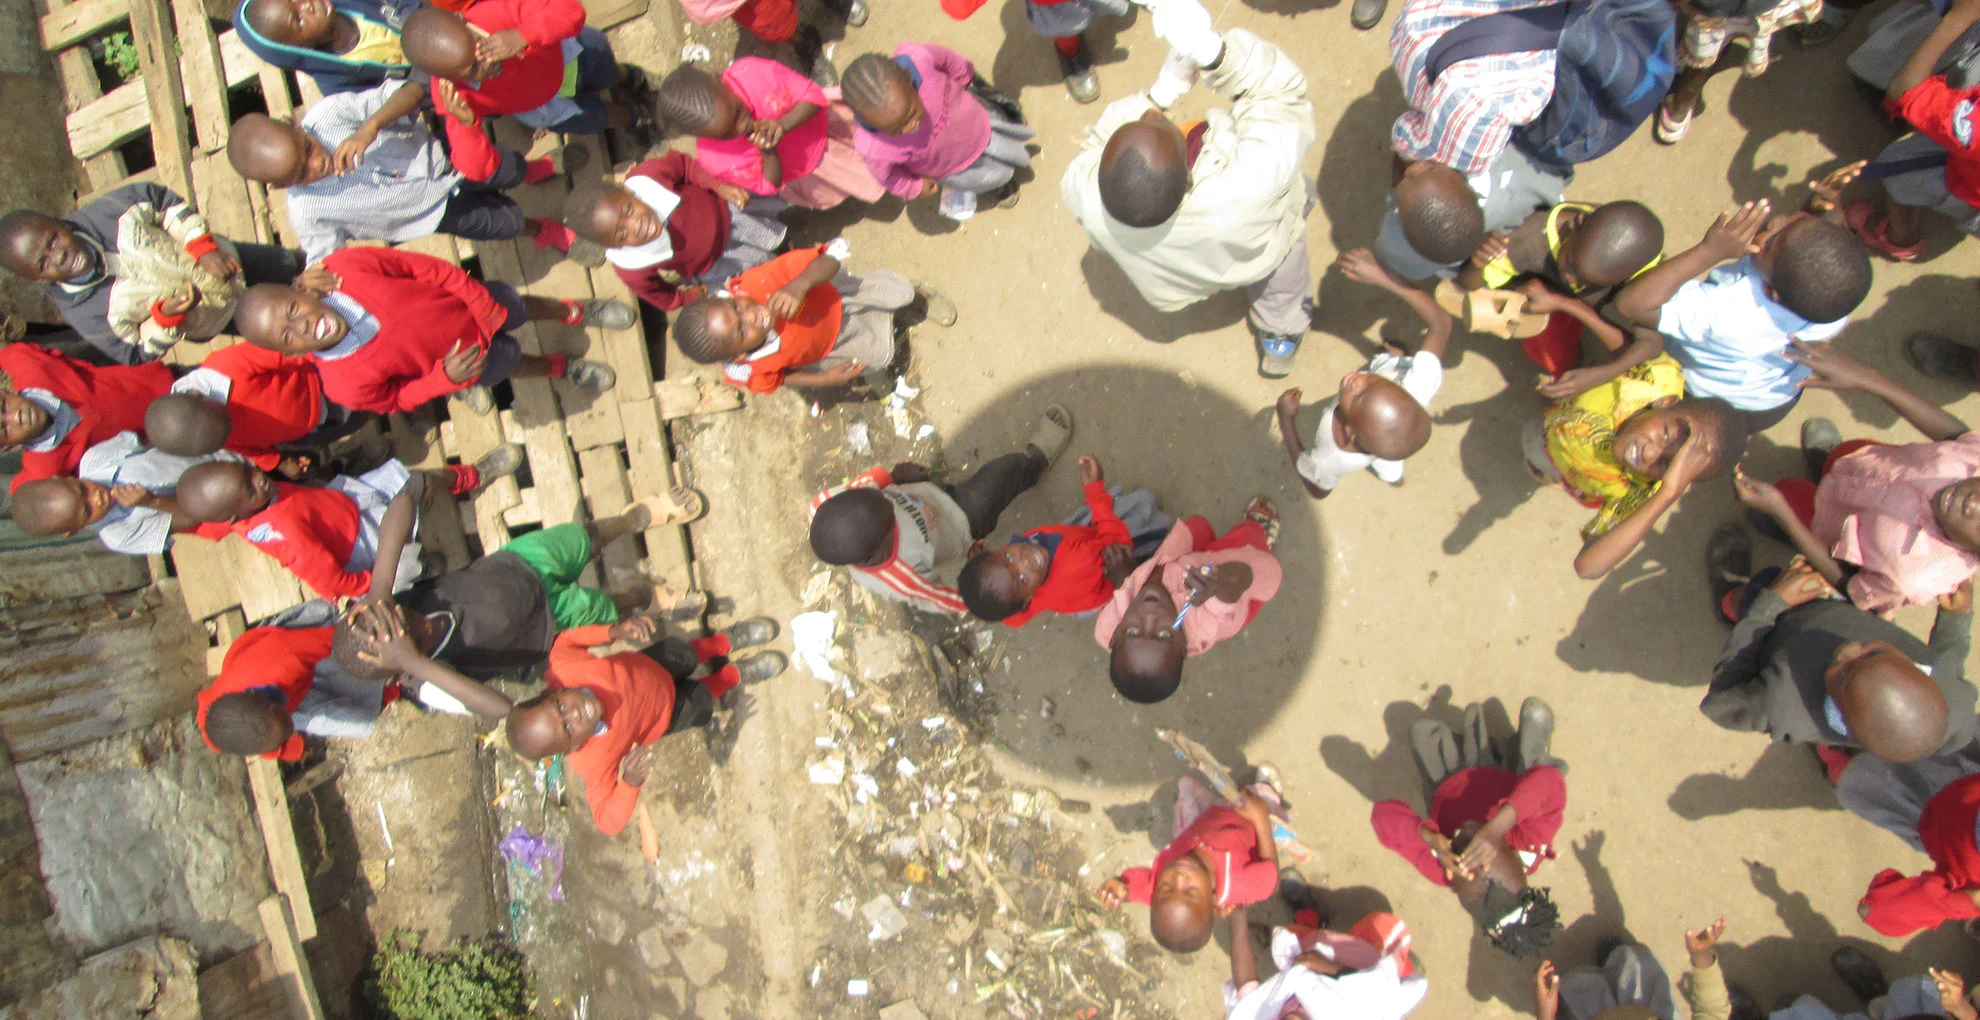


Gallery of 9 images. Launching a balloon and resulting dialogue.
Once the data collection and physical mapping are complete, the results and aerial photographs are shared and discussed with the community. During this process of analysis the primary concerns of residents emerge and are ranked by importance. In the Mungaano project, this revealed links between food vending, urban health, food security and environmental hazards. The challenges that emerged include risks of contamination from pests, overflowing sewers, livestock and unsafe water, as well as poor hygiene and food handling practices. The analysis (6) enabled community members to identify solutions to advocate for, such as:
Training to improve food hygiene
Clean-up exercises
Designated waste disposal sites
Improved water provision, sanitation and lighting
Communal storage and refrigeration facilities
(6) Ahmed, S. et al. 2015. Cooking up a storm: Community-led mapping and advocacy with food vendors in Nairobi’s informal settlements. IIED Working Paper.Githiri, G., Ngugi, R., Njoroge, P. & Sverdlik, A. 2015. Nourishing Livelihoods: Recognising and Supporting Food Vendors in Nairobi’s Informal Settlements. IIED Working Paper.
“This [process] has helped the community understand the issues of health, safety, and wellbeing. The collection of data, the trainings, the awareness, the mobilization, have helped the community […] to understand their issues so that they can push the bigger agenda of the Federation and of the community”–Rashid Mutua, National Chairperson Muungano wa Wanavijiji
“I’m struck by how successfully a balloon can take an aerial map of my settlement. I am aware there is a hidden camera in the balloon, this is a noble innovation”– Community observer of the aerial mapping process in Mathare (7)
(7) Ahmed, S. et al. 2015. Cooking up a storm: Community-led mapping and advocacy with food vendors in Nairobi’s informal settlements. IIED Working Paper.
This final phase of community-led mapping is fundamental as it is also the start of a new process of engagement and negotiation with local government. In this context, organized urban poor communities can support their claims with verifiable data gathered through an inclusive mapping process.
By putting themselves on the map, the food vendors of Nairobi’s informal settlements have shown how they much they matter to local food security and what local government and residents can do to recognise and support them. They have become visible.